



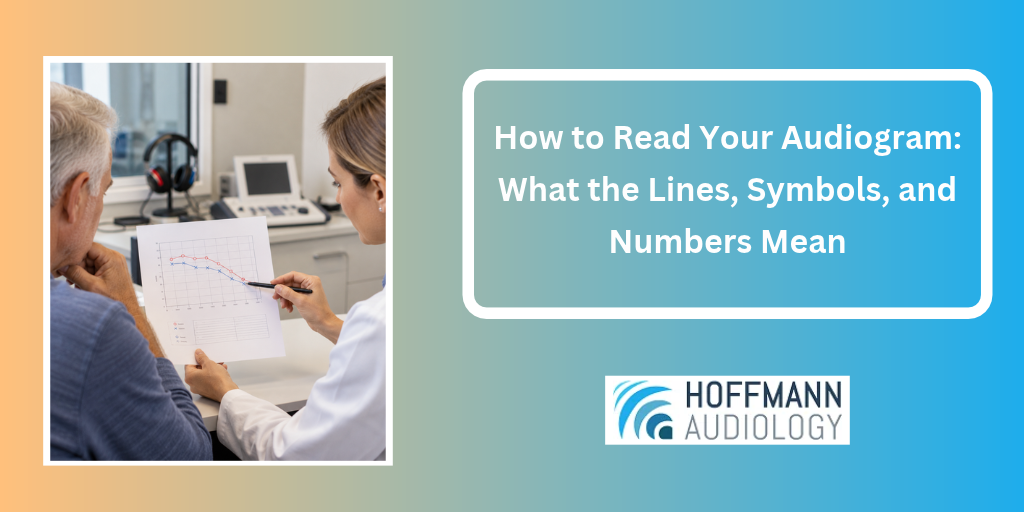
You leave a hearing test holding a page of Xs, Os, and a line that dips and climbs like a tiny mountain range. Someone said “mild” or “moderate,” you nodded, and now the page sits on the kitchen counter looking like a foreign language.
That chart is called an audiogram, and it is one of the most readable pictures of your hearing once you know the rules. It plots the softest sounds you could detect at different pitches, one ear at a time. Here is how to decode it.
An audiogram is a simple graph. The horizontal axis shows pitch, measured in hertz (Hz). Low sounds, like a bass drum or a truck engine, sit on the left.
High sounds, like a bird chirp or the “s” in “sun,” sit on the right. Testing usually covers roughly 250 Hz up to 4,000 Hz.
The vertical axis shows loudness, measured in decibels hearing level (dB HL). Here is the part that trips people up: soft sounds sit at the top of the chart and loud sounds sit at the bottom.
A mark that falls lower on the page means the tone had to be louder before you noticed it.
Each mark is a threshold, the softest tone you responded to at that pitch. A red O stands for your right ear and a blue X for your left. Connect the marks for one ear and you get a line that shows how that ear performs across the pitches.
Tones usually travel through headphones first. This is called air conduction, and it tests the entire path, from outer ear to inner ear.
A second round uses a small transducer placed behind the ear. This is a bone conduction test, and it sends vibration straight to the inner ear, bypassing the outer and middle ear.
Those marks use different symbols. When the air and bone marks line up, the issue is likely in the inner ear. A gap between them is a clue that the outer or middle ear may be involved.
The numbers on the left side give your results a label. Audiologists commonly use the ranges below, published by the American Speech-Language-Hearing Association from a classic 1981 scheme.
| Degree of Hearing Loss | Range (dB HL) |
|---|---|
| Normal | -10 to 15 |
| Slight | 16 to 25 |
| Mild | 26 to 40 |
| Moderate | 41 to 55 |
| Moderately Severe | 56 to 70 |
| Severe | 71 to 90 |
| Profound | 91 and above |
Your audiologist rarely labels you from a single dot. The label usually reflects several pitches together, and it can differ between your two ears.
Two people can both have “mild” loss and still hear very differently, because the shape of the line tells its own story. A line that slopes downward toward the right means high pitches are harder to hear than low ones. This pattern is common with gradual, age-related changes.
Why does that matter in everyday life? Many consonants, such as s, f, and th, are high-pitched and quiet. When those slip away, people seem to mumble even though their voices sound loud enough.
A flat line suggests similar loss across pitches. A sudden dip in the higher pitches, with better hearing on either side, can sometimes be associated with noise exposure. Your audiologist reads these patterns together with your history before drawing conclusions.
An audiogram measures tones. It does not show how clearly you understand words, especially with a noisy room around you. That is why a full evaluation adds speech testing, which checks how well you recognize spoken words, sometimes with background noise added.
An audiogram also does not diagnose a cause on its own. It is one piece of the puzzle, along with your health history, a look at the ear canal, and sometimes a check of how the eardrum moves.
Its greatest strength may be comparison over time. A single chart is a snapshot. Two charts, a year apart, show whether anything has shifted, which is one reason repeat testing matters.
To see how early testing fits into long-term hearing health, read about how hearing tests help detect early hearing loss.
Walk in with a few questions, and the audiogram becomes a conversation instead of a verdict. Consider asking:
You can also ask for a copy of the chart to keep. Having your own record makes the next comparison easy.
Hoffmann Audiology offers diagnostic hearing evaluations in Irvine, and Dr. Hoffmann takes the time to review each result and answer your questions.
Contact us to schedule a visit, and leave a comment below if you have a general question about reading an audiogram.
1. What is a normal result on an audiogram?
Marks in the range of -10 to 15 dB HL are generally considered normal hearing.
2. Why are there two lines on my audiogram?
Each ear is tested separately. Red O marks show the right ear and blue X marks show the left.
3. Does a lower mark mean better hearing?
No. Lower on the chart means louder sounds were needed, so a lower mark points to more hearing loss at that pitch.
4. Can my audiogram change over time?
Yes. Hearing can shift, which is why repeat testing and comparing charts is useful.
5. Does the audiogram show how well I understand speech?
Not by itself. Speech testing is added to show how clearly you recognize words.

Be the first to post a comment
Leave a Reply Cancel reply